Global equity and fixed income outlook
July 13, 2022
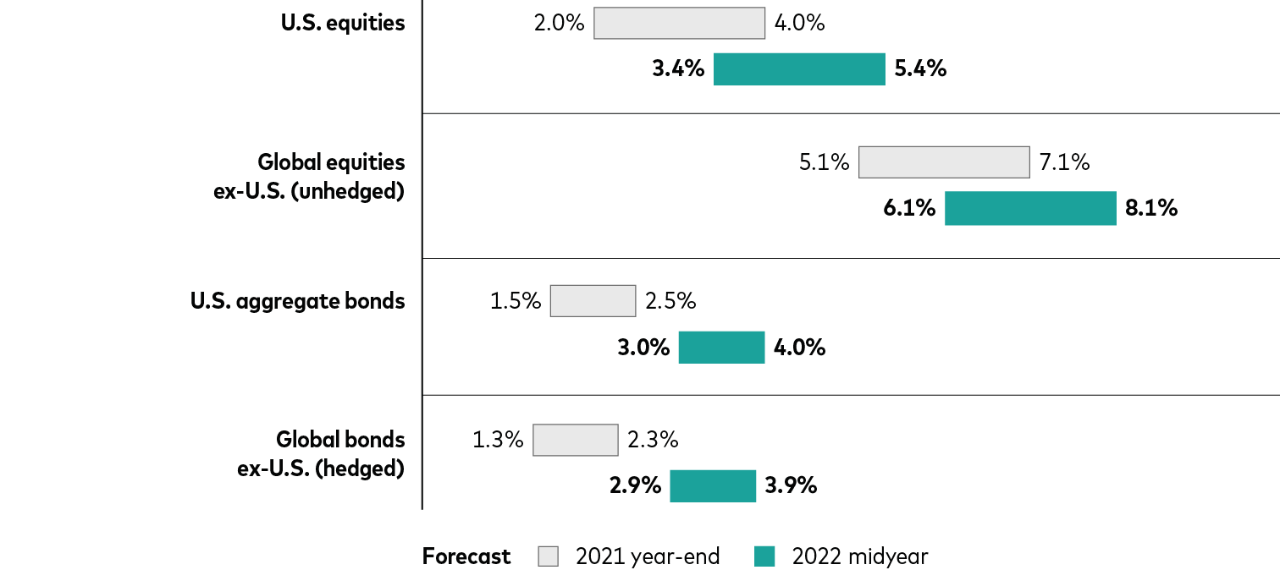
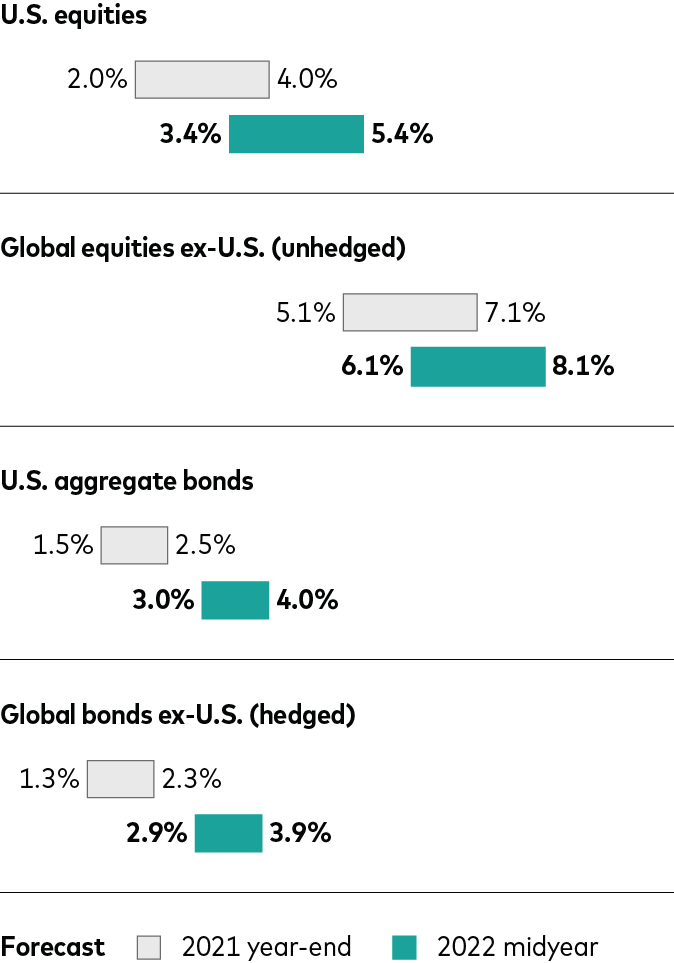
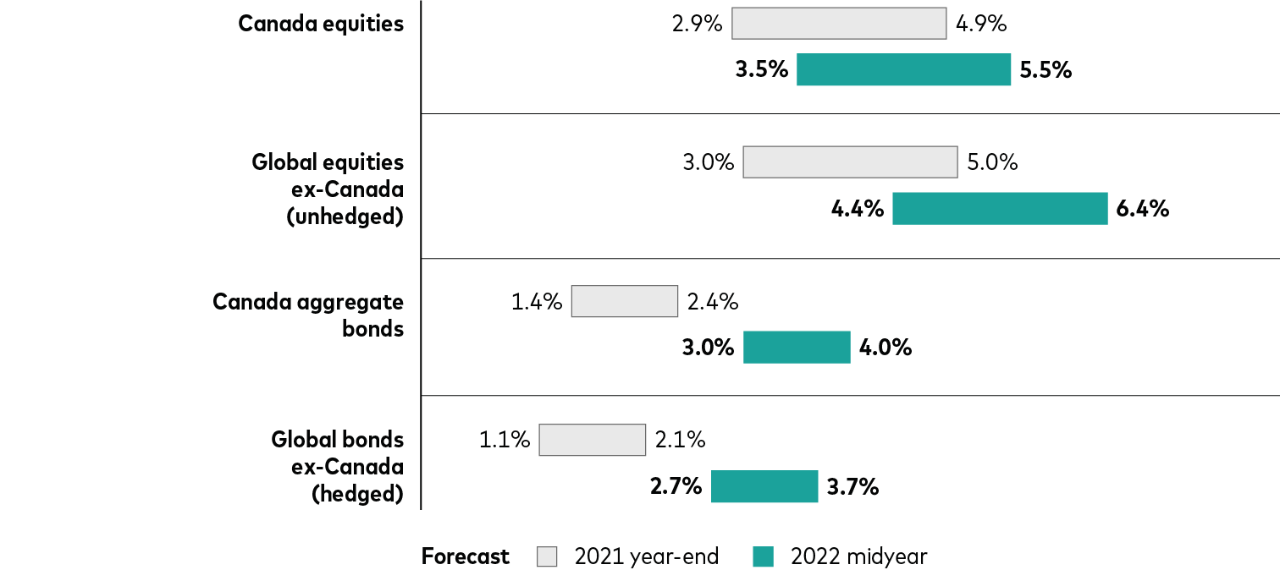
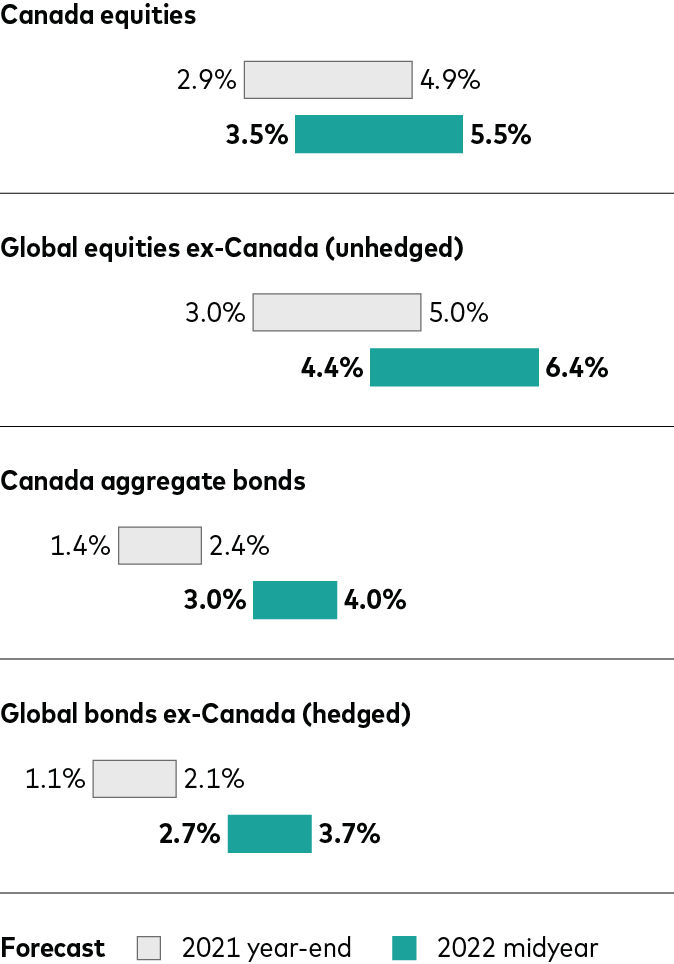
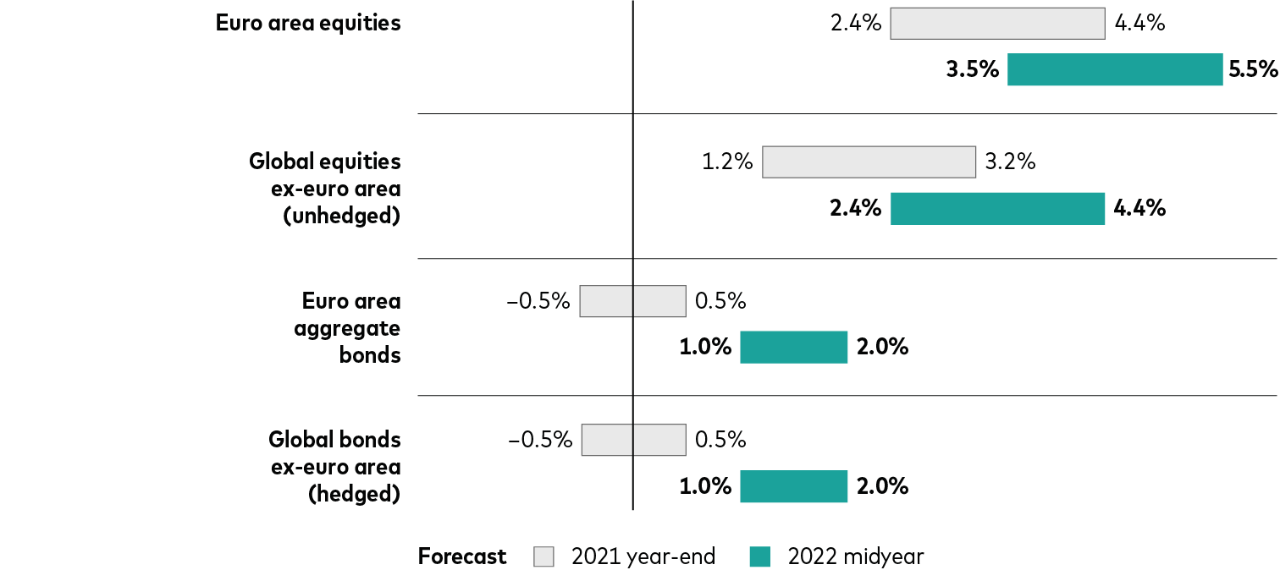
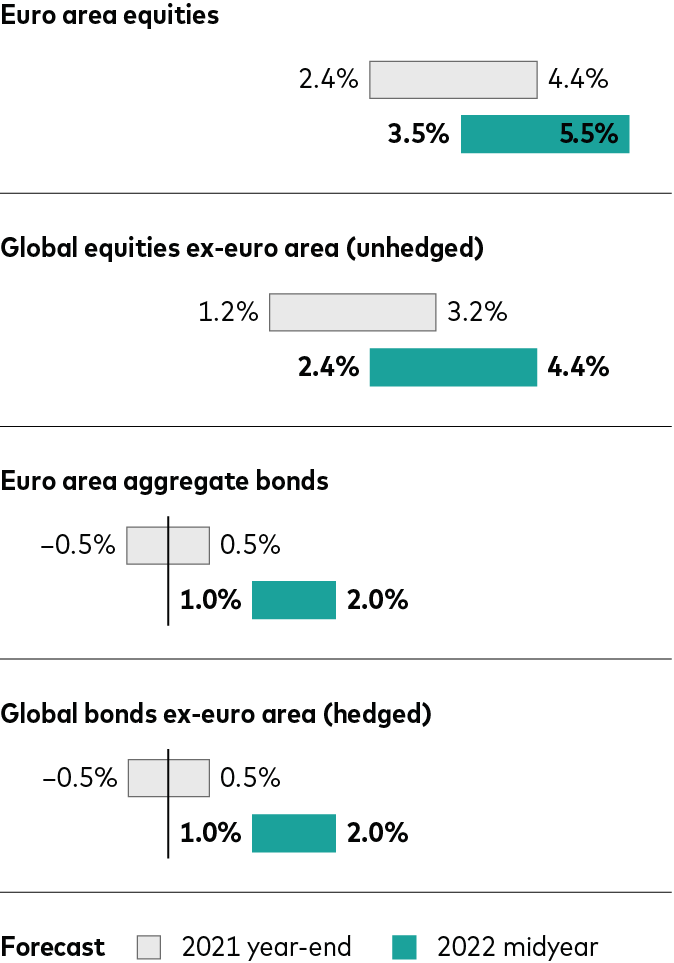
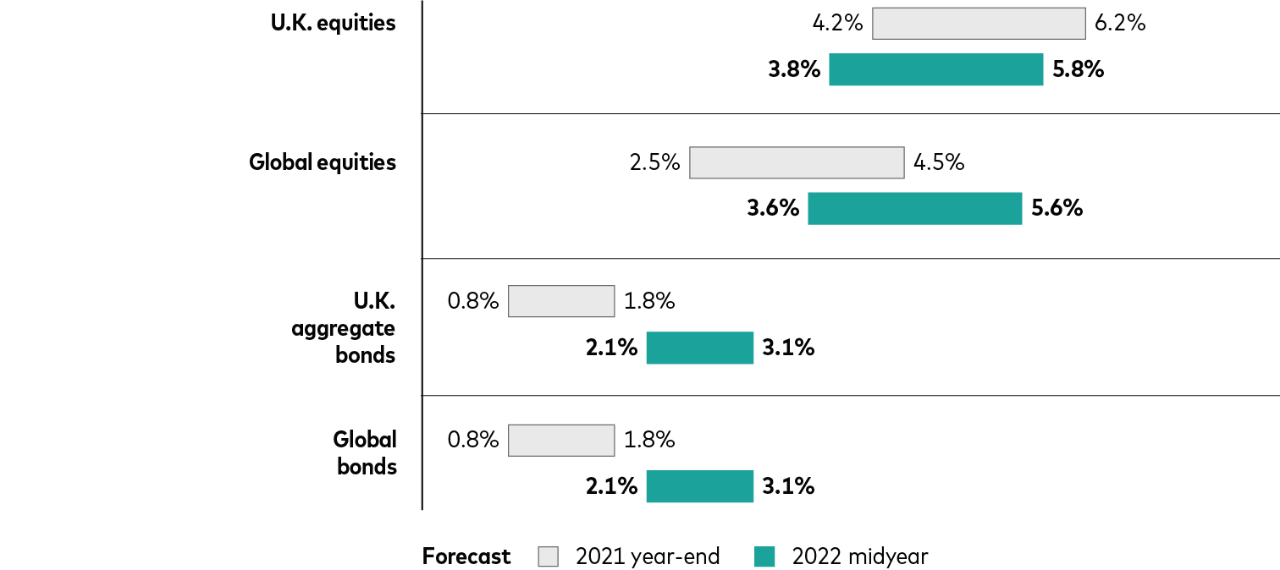
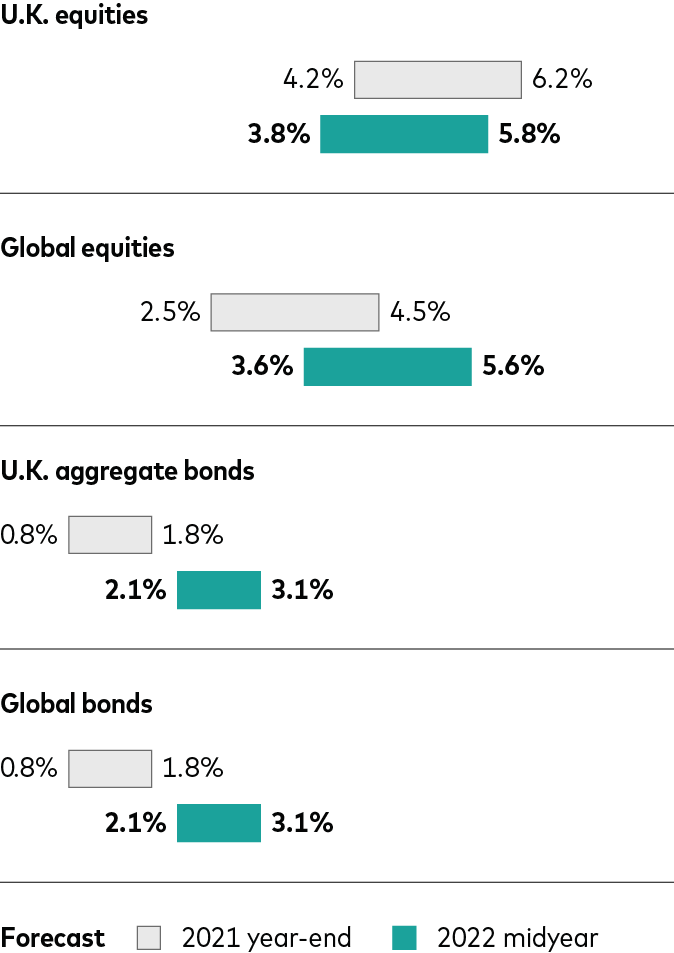
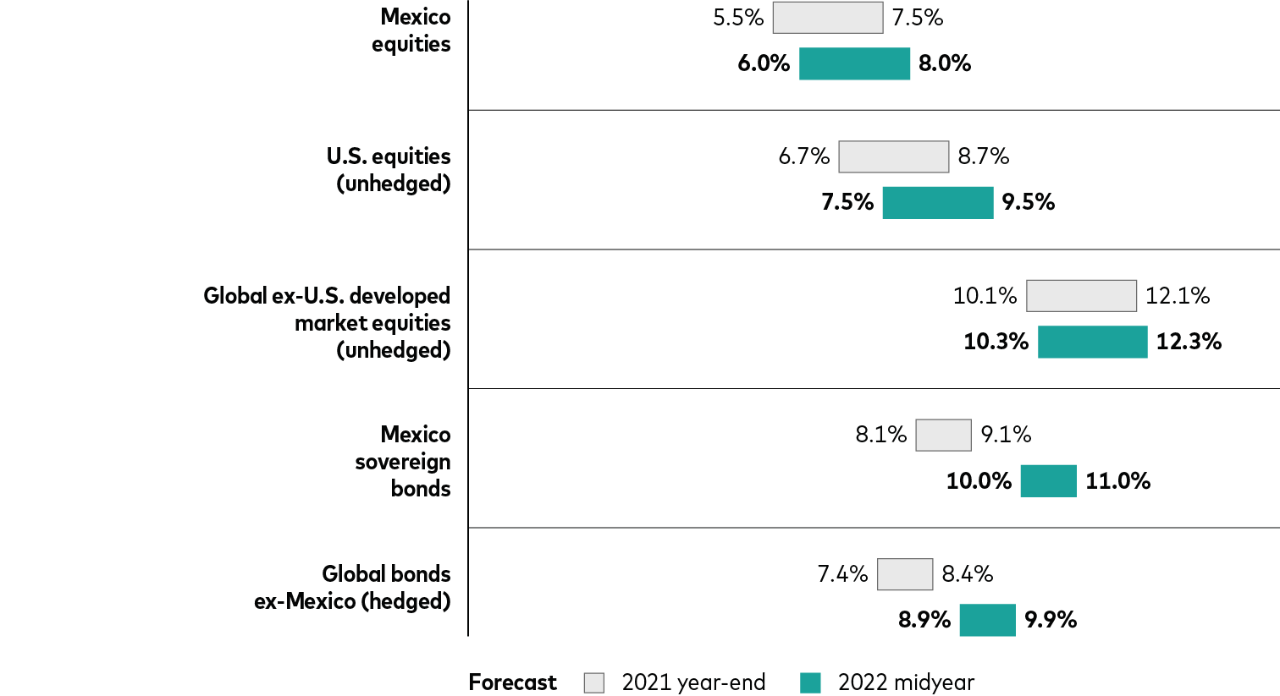
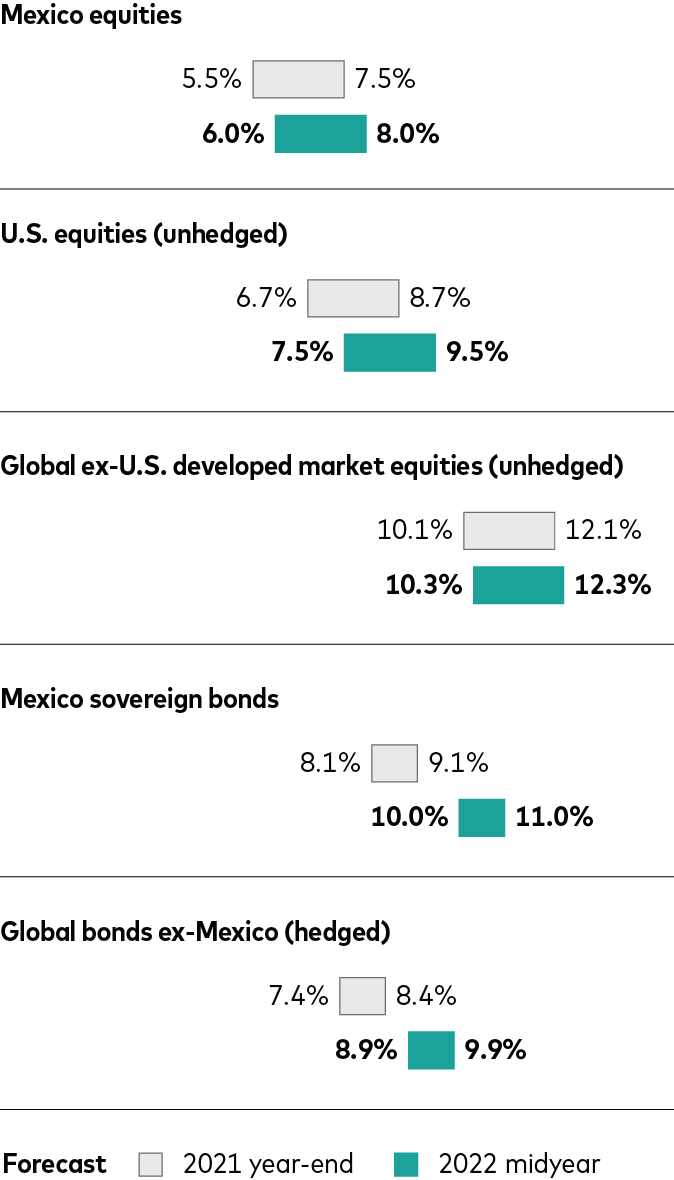
Falling equity valuations and rising interest rates have largely increased our 10-year annualized developed market return forecasts in the first five months of 2022 by about 1 percentage point for stocks and 1.5 percentage points for bonds.
Our current forecasts are derived from a May 31, 2022, running of the Vanguard Capital Markets Model®, compared with a December 31, 2021, running of the VCMM. Forecasts are from the perspective of local investors in local currencies.
U.S. dollar
Canadian dollar
Euro
British pound
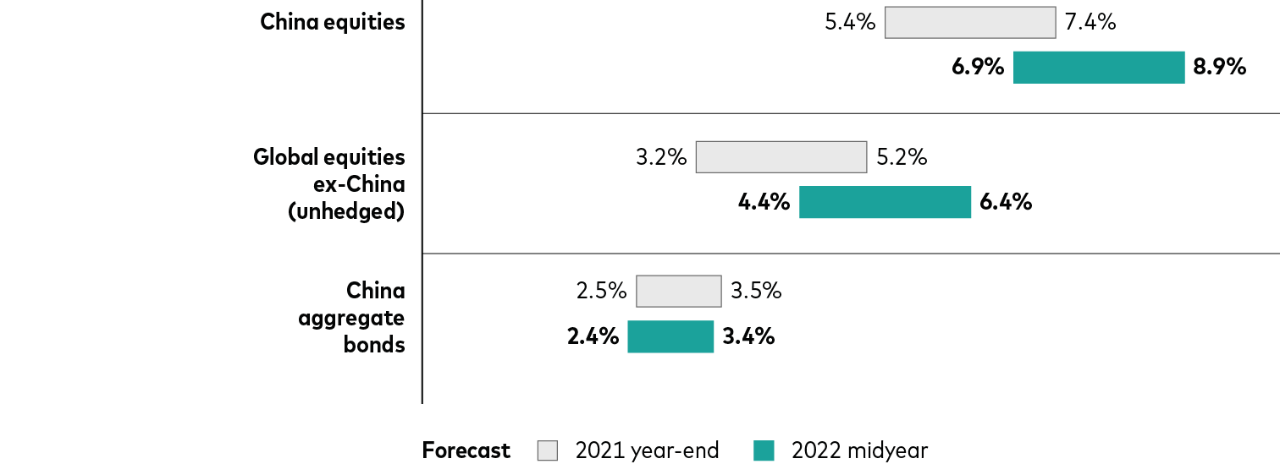
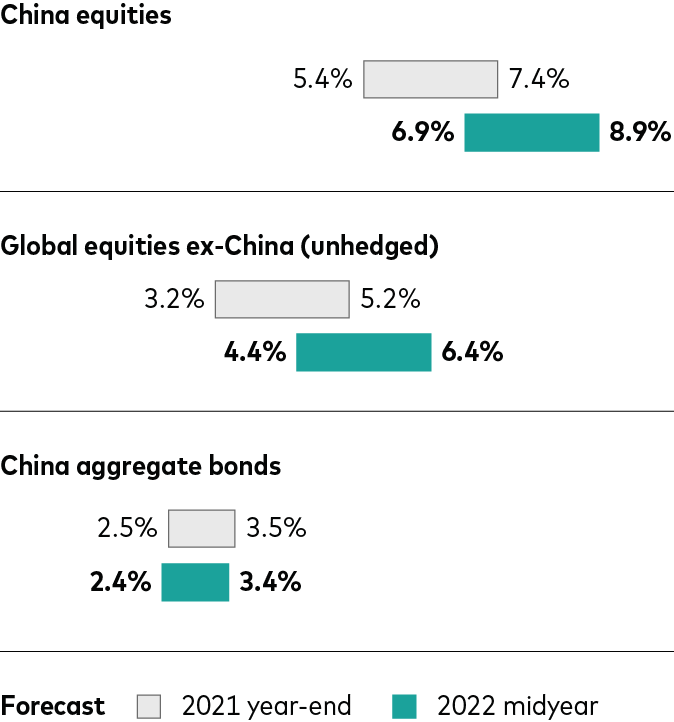
Chinese yuan
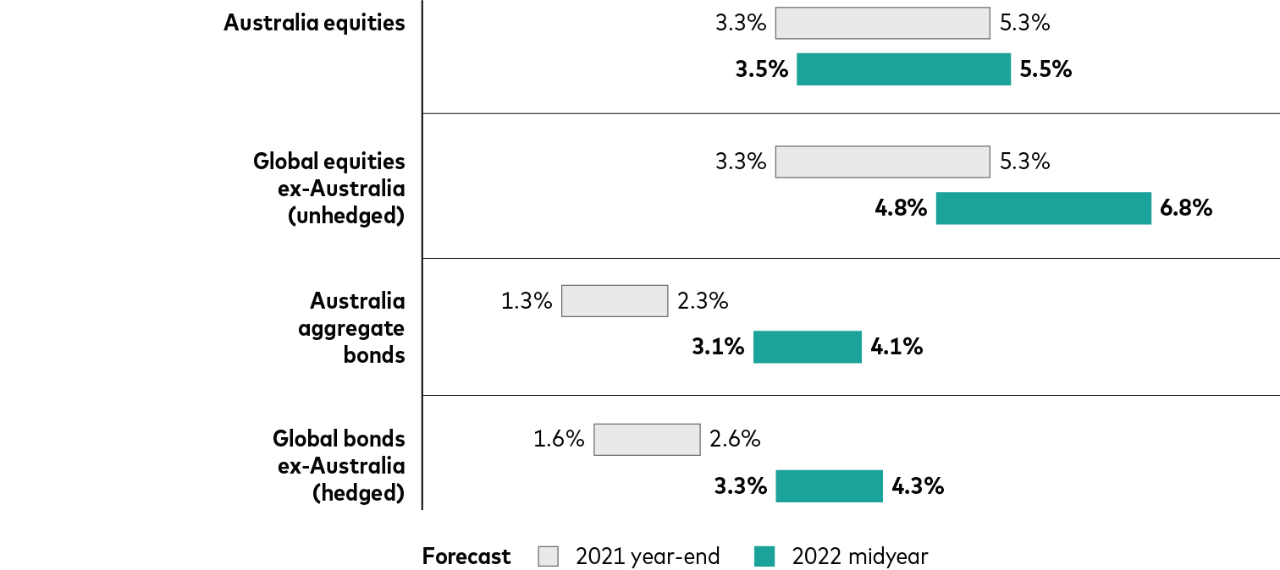
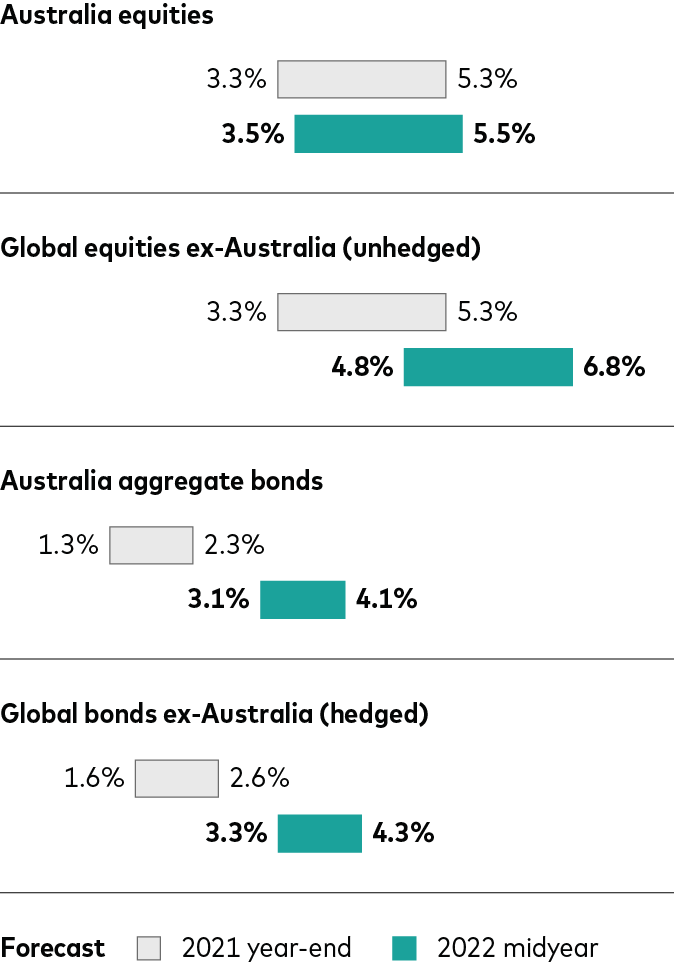
Australian dollar
Mexican peso
IMPORTANT: The projections or other information generated by the Vanguard Capital Markets Model regarding the likelihood of various investment outcomes are hypothetical in nature, do not reflect actual investment results, and are not guarantees of future results. Distribution of return outcomes from the VCMM are derived from 10,000 simulations for each modeled asset class. Simulations are as of December 31, 2021, and May 31, 2022. Results from the model may vary with each use and over time. For more information, please see the Notes section below.
Notes: Figures are based on a 1-point range around the 50th percentile of the distribution of return outcomes for equities and a 0.5-point range around the 50th percentile for fixed income.
Source: Vanguard.
Notes:
All investing is subject to risk, including the possible loss of the money you invest. Diversification does not ensure a profit or protect against a loss in a declining market. Be aware that fluctuations in the financial markets and other factors may cause declines in the value of your account. There is no guarantee that any particular asset allocation or mix of funds will meet your investment objectives or provide you with a given level of income.
Investments in stocks and bonds issued by non-U.S. companies are subject to risks including country/regional risk and currency risk. These risks are especially high in emerging markets.
Bond funds are subject to the risk that an issuer will fail to make payments on time, and that bond prices will decline because of rising interest rates or negative perceptions of an issuer’s ability to make payments.
About the Vanguard Capital Markets Model
IMPORTANT: The projections and other information generated by the Vanguard Capital Markets Model regarding the likelihood of various investment outcomes are hypothetical in nature, do not reflect actual investment results, and are not guarantees of future results. VCMM results will vary with each use and over time.
The VCMM projections are based on a statistical analysis of historical data. Future returns may behave differently from the historical patterns captured in the VCMM. More important, the VCMM may be underestimating extreme negative scenarios unobserved in the historical period on which the model estimation is based.
The Vanguard Capital Markets Model® is a proprietary financial simulation tool developed and maintained by Vanguard’s Investment Strategy Group. The model forecasts distributions of future returns for a wide array of broad asset classes. Those asset classes include U.S. and international equity markets, several maturities of the U.S. Treasury and corporate fixed income markets, international fixed income markets, U.S. money markets, commodities, and certain alternative investment strategies. The theoretical and empirical foundation for the Vanguard Capital Markets Model is that the returns of various asset classes reflect the compensation investors require for bearing different types of systematic risk (beta). At the core of the model are estimates of the dynamic statistical relationship between risk factors and asset returns, obtained from statistical analysis based on available monthly financial and economic data. Using a system of estimated equations, the model then applies a Monte Carlo simulation method to project the estimated interrelationships among risk factors and asset classes as well as uncertainty and randomness over time. The model generates a large set of simulated outcomes for each asset class over several time horizons. Forecasts are obtained by computing measures of central tendency in these simulations. Results produced by the tool will vary with each use and over time.
The primary value of the VCMM is in its application to analyzing potential client portfolios. VCMM asset-class forecasts—comprising distributions of expected returns, volatilities, and correlations—are key to the evaluation of potential downside risks, various risk–return trade-offs, and the diversification benefits of various asset classes. Although central tendencies are generated in any return distribution, Vanguard stresses that focusing on the full range of potential outcomes for the assets considered, such as the data presented in this paper, is the most effective way to use VCMM output.
The VCMM seeks to represent the uncertainty in the forecast by generating a wide range of potential outcomes. It is important to recognize that the VCMM does not impose “normality” on the return distributions, but rather is influenced by the so-called fat tails and skewness in the empirical distribution of modeled asset-class returns. Within the range of outcomes, individual experiences can be quite different, underscoring the varied nature of potential future paths. Indeed, this is a key reason why we approach asset-return outlooks in a distributional framework.
Indexes used in Vanguard Capital Markets Model simulations
The long-term returns of our hypothetical portfolios are based on data for the appropriate market indexes as of December 31, 2021, and May 31, 2022. We chose these benchmarks to provide the most complete history possible, and we apportioned the global allocations to align with Vanguard’s guidance in constructing diversified portfolios. Asset classes and their representative forecast indexes are as follows:
U.S. equities: MSCI US Broad Market Index.
Global ex-U.S. equities: MSCI All Country World ex USA Index.
U.S. aggregate bonds: Bloomberg U.S. Aggregate Bond Index.
Global ex-U.S. bonds: Bloomberg Global Aggregate ex-USD Index.
Canadian equities: MSCI Canada Total Return Index.
Global ex-Canada equities: MSCI All Country World Index ex-Canada in CAD.
Canadian aggregate bonds: Bloomberg Canadian Issues 300MM Index.
Global ex-Canada bonds: Bloomberg Global Aggregate ex-Canada Index (CAD Hedged).
UK equities: Bloomberg Equity Gilt Study from 1900 to 1964, Thomson Reuters Datastream UK Market Index 1965 to 1969; MSCI UK thereafter.
Global ex-UK equities: S&P 90 Index from January 1926 to 3 March 1957; S&P 500 Index from 4 March 1957 to 1969; MSCI World ex UK from 1970 to 1987; MSCI AC World ex UK from 1988 onwards.
UK aggregate bonds: Bloomberg Sterling Aggregate Bond Index.
Global ex-UK bonds: Standard & Poor’s High Grade Corporate Index from 1926 to 1968, Citigroup High Grade Index from 1969 to 1972, Lehman Brothers US Long Credit AA Index from 1973 to 1975, Bloomberg US Aggregate Bond Index from 1976 to 1990, Bloomberg Global Aggregate Index from 1990 to 2001; Bloomberg Global Aggregate ex GBP Index from 2001 onwards.
Euro area equities: MSCI European Economic and Monetary Union (EMU) Index.
Global ex-euro area equities: MSCI AC World ex EMU Index.
Euro area aggregate bonds: Bloomberg Euro-Aggregate Bond Index.
Global ex-euro area bonds: Bloomberg Global Aggregate ex Euro Index.
Australian equities: MSCI Australia Index.
Global ex-Australia equities: MSCI All Country World ex-Australia Index.
Australian bonds: Bloomberg Australian Aggregate Bond Index.
Global ex-Australia bonds: Bloomberg Global Aggregate ex-AUS Bond Index.
China equities: MSCI China A Onshore Index.
Global equities ex-China: MSCI All Country World ex China Index.
China aggregate bonds: ChinaBond Aggregate Index.
Mexico equities: MSCI Mexico Index.
Global ex-U.S. developed market equities: MSCI World ex US Index.
Mexico sovereign bonds: S&P/BMV Sovereign MBONOS Bond Index.
Global bonds ex-Mexico: Bloomberg Global Aggregate Index.
A closer look

Our midyear 2022 outlook
Recession isn’t a foregone conclusion, but curbing inflation without stifling growth will be hard.

Americas
A U.S. “soft landing” is looking less likely with the Federal Reserve’s higher policy rate landscape.

Europe
Our outlook for the euro area has been downgraded amid energy prices sent soaring by war.

Asia-Pacific
China’s growth target of about 5.5% is vulnerable given the weak labor market and slowing global growth.

Time-varying portfolios
Strategic asset allocation, not market timing, may benefit some investors given changing conditions.