An animated pattern showing Vanguard's 50th anniversary logo.

50 years of changing the way the world invests

The

Vanguard

Effect

Vanguard’s low-cost investments have created competition in the markets, pressuring asset managers to reduce their fees to remain competitive. Today, Vanguard’s ability to lower fees across the industry is widely known as The Vanguard Effect®.

The Vanguard Effect:
Lower costs, higher value since 1975

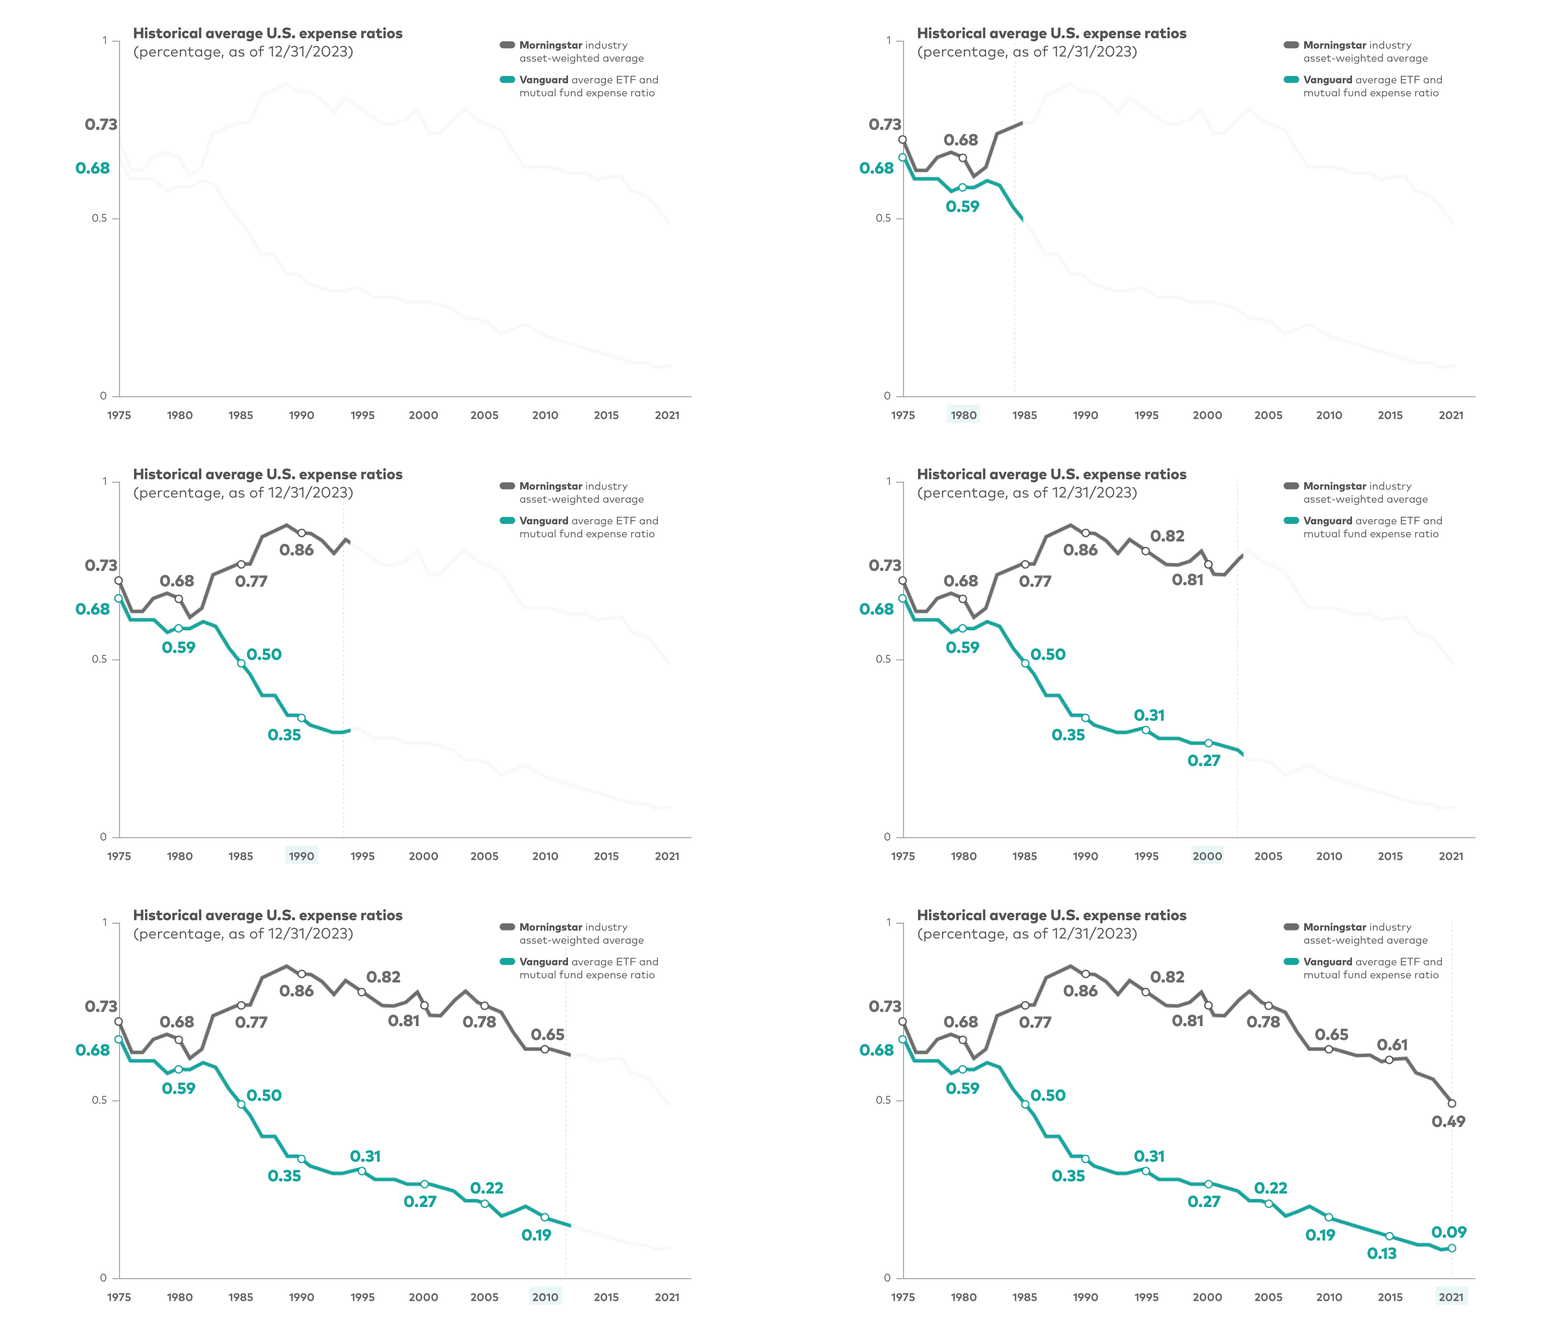
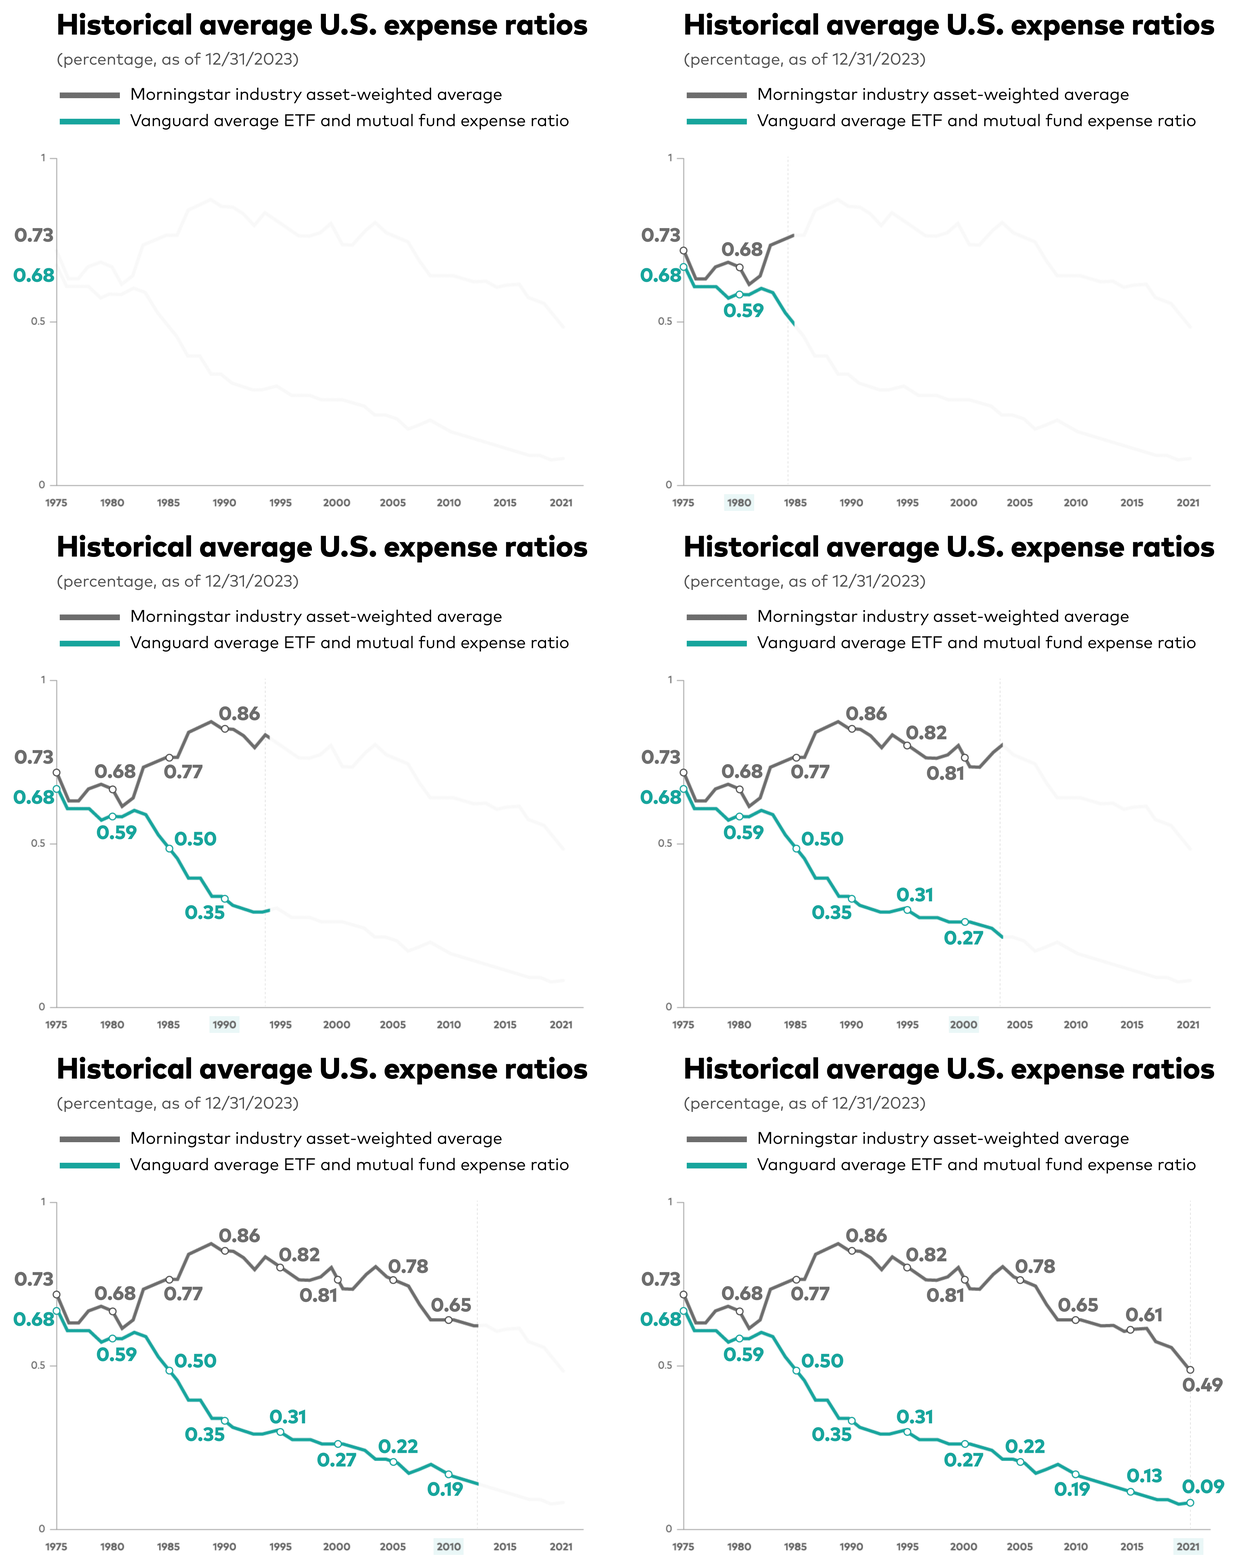
The animated graph shows historical average U.S. mutual fund and ETF expense ratios and compares Vanguard's expense ratio versus competitors as represented by using Morningstar data from 1975 through Dec 31, 2023. Vanguard's average mutual fund and ETF expense ratio has dropped from 0.68% to 0.09% while the industry average has dropped from 0.73% to 0.49% during the same time period. Sources: Vanguard and Morningstar, Inc. U.S. only. Reflects asset-weighted average U.S. combined mutual fund and ETF expenses, as a share of average new U.S. assets. Updated mid-February / March for the previous year. The animated graph shows historical average U.S. mutual fund and ETF expense ratios and compares Vanguard's expense ratio versus competitors as represented by using Morningstar data from 1975 through Dec 31, 2023. Vanguard's average mutual fund and ETF expense ratio has dropped from 0.68% to 0.09% while the industry average has dropped from 0.73% to 0.49% during the same time period. Sources: Vanguard and Morningstar, Inc. U.S. only. Reflects asset-weighted average U.S. combined mutual fund and ETF expenses, as a share of average new U.S. assets. Updated mid-February / March for the previous year.

Sources: Vanguard and Morningstar, Inc. U.S. only. Reflects asset-weighted average U.S. combined mutual fund and ETF expenses, as a share of average new U.S. assets. Updated mid-February / March for the previous year.

Transcript

I think it's fair to say that Vanguard is a remarkable company. 
Probably anybody could make a statement like that.

But we are remarkable and unique actually in a number of ways.

 
First is our corporate structure.

We're owned by the shareholders.

Our mission is to serve them and not some outside management company owner.

 
Second, we that's structure leads to a very different strategy from most firms in this business.

We focus on low cost and which helps us guarantee about the only guarantee there is out in this mutual fund world that our investors will capture their share of whatever returns to stock and bond markets deliver to us.

And that's not a formal guarantee, but it's, that's what the math says and what the math proves and it's immutable and eternal.

 
And I don't think it's self-serving to say that we are a company that is of the shareholder, by the shareholder and for the shareholder and with the crew that understands that and implements it really quite beautifully.

Video from Vanguard’s founder, John C. Bogle

Video from Vanguard’s founder, John C. Bogle

Share certificate for the First Index Investment Trust (now Vanguard 500 Index Fund)

Share certificate for the First Index Investment Trust (now Vanguard 500 Index Fund)

This image represents a bar chart with a downward slope of costs over an extended period of time and this reflects Vanguard's approach to lowering the cost of investing over the last 50 years.
An image of the letter V displayed as a constellation against a dark background of distant stars.

The original Vanguard website experience

An image displaying the original Vanguard website homepage from 1995 that launched our online experience.

The original Vanguard website experience

An image of an iconic red double decker bus passing by the 16-story Big Ben clocktower in London, United Kingdom.
A collage of facial portraits.

Historical artwork from Vanguard ETF campaign.

Historical artwork from Vanguard ETF campaign.

The Letter V created using thousands of colored dots.
A personal investor reading about Vangaurd's advice offering on their phone.

New leadership,
same mission


Photograph of Salim Ramji, Vanguard's CEO

Salim Ramji

CEO

Senior financial services executive Salim Ramji joined Vanguard as CEO in July 2024 after more than 25 years in senior leadership roles across investments, capital markets, and wealth management.

The current investor landscape is changing, and that presents opportunities for Vanguard to further its mission of giving people the best chance for investment success, which is more relevant today than at any time in the firm’s five-decade history. My focus is to mobilize Vanguard to meet the moment while staying true to that core purpose—remaining the trusted firm that takes a stand for all investors.
Photograph of Greg Davis, Vanguard President and Chief Investment Officer

Greg Davis

President

Vanguard president, chief investment officer, and board of directors’ member, Greg Davis oversees all aspects of the firm’s investment management and enterprise risk management. A 25-year Vanguard veteran and respected industry thought leader, he is a champion of product innovation at Vanguard and routinely advocates for regulatory changes that benefit everyday investors.​

For nearly 50 years we have kept our clients at the forefront of the decisions we make, and that commitment remains today. We’re thrilled to take Vanguard into its next chapter of helping to give investors the best chance for investment success.
Father and Son walking on the beach and sharing a personal moment
2025

Vanguard celebrates 50 years

As we proudly celebrate our 50th anniversary in business on May 1, 2025, we extend our deepest gratitude to you, our clients, partners, and crew, for your continued support of our mission to take a stand for all investors.

This is only the beginning.

Vanguard at 50

Vanguard Effect:

Lower costs, higher value since 1975

An image of a graph displaying historical average U.S. mutual fund and ETF expense ratios and compares Vanguard's expense ratio versus competitors as represented by using Morningstar data. For 2015, Vanguard's average expense ration was 0.13% compared to the industry average of 0.61%.  Sources: Vanguard and Morningstar, Inc. U.S. only. Reflects asset-weighted average U.S. combined mutual fund and ETF expenses, as a share of average new U.S. assets. Updated mid-February / March for the previous year. An image of a graph displaying historical average U.S. mutual fund and ETF expense ratios and compares Vanguard's expense ratio versus competitors as represented by using Morningstar data. For 2015, Vanguard's average expense ration was 0.13% compared to the industry average of 0.61%.  Sources: Vanguard and Morningstar, Inc. U.S. only. Reflects asset-weighted average U.S. combined mutual fund and ETF expenses, as a share of average new U.S. assets. Updated mid-February / March for the previous year.

Sources: Vanguard and Morningstar, Inc. U.S. only. Reflects asset-weighted average U.S. combined mutual fund and ETF expenses, as a share of average new U.S. assets. Updated mid-February / March for the previous year.

Vanguard Effect:

Lower costs, higher value since 1975

An image of a graph displaying historical average U.S. mutual fund and ETF expense ratios and compares Vanguard's expense ratio versus competitors as represented by using Morningstar data. For 2014, Vanguard's average expense ration was 0.14% compared to the industry average of 0.63%.  Sources: Vanguard and Morningstar, Inc. U.S. only. Reflects asset-weighted average U.S. combined mutual fund and ETF expenses, as a share of average new U.S. assets. Updated mid-February / March for the previous year. An image of a graph displaying historical average U.S. mutual fund and ETF expense ratios and compares Vanguard's expense ratio versus competitors as represented by using Morningstar data. For 2014, Vanguard's average expense ration was 0.14% compared to the industry average of 0.63%.  Sources: Vanguard and Morningstar, Inc. U.S. only. Reflects asset-weighted average U.S. combined mutual fund and ETF expenses, as a share of average new U.S. assets. Updated mid-February / March for the previous year.

Sources: Vanguard and Morningstar, Inc. U.S. only. Reflects asset-weighted average U.S. combined mutual fund and ETF expenses, as a share of average new U.S. assets. Updated mid-February / March for the previous year.

Vanguard Effect:

Lower costs, higher value since 1975

An image of a graph displaying historical average U.S. mutual fund and ETF expense ratios and compares Vanguard's expense ratio versus  competitors as represented by using Morningstar data. For 2011, Vanguard's average expense ration was 0.17% compared to the industry average of 0.65%.  Sources: Vanguard and Morningstar, Inc. U.S. only. Reflects asset-weighted average U.S. combined mutual fund and ETF expenses, as a share of average new U.S. assets. Updated mid-February / March for the previous year. An image of a graph displaying historical average U.S. mutual fund and ETF expense ratios and compares Vanguard's expense ratio versus  competitors as represented by using Morningstar data. For 2011, Vanguard's average expense ration was 0.17% compared to the industry average of 0.65%.  Sources: Vanguard and Morningstar, Inc. U.S. only. Reflects asset-weighted average U.S. combined mutual fund and ETF expenses, as a share of average new U.S. assets. Updated mid-February / March for the previous year.

Sources: Vanguard and Morningstar, Inc. U.S. only. Reflects asset-weighted average U.S. combined mutual fund and ETF expenses, as a share of average new U.S. assets. Updated mid-February / March for the previous year.

Vanguard Effect:

Lower costs, higher value since 1975

An image of a graph displaying historical average U.S. mutual fund and ETF expense ratios and compares Vanguard's expense ratio versus  competitors as represented by using Morningstar data. For 2001, Vanguard's average expense ration was 0.27% compared to the industry average of 0.74%.  Sources: Vanguard and Morningstar, Inc. U.S. only. Reflects asset-weighted average U.S. combined mutual fund and ETF expenses, as a share of average new U.S. assets. Updated mid-February / March for the previous year. An image of a graph displaying historical average U.S. mutual fund and ETF expense ratios and compares Vanguard's expense ratio versus  competitors as represented by using Morningstar data. For 2001, Vanguard's average expense ration was 0.27% compared to the industry average of 0.74%.  Sources: Vanguard and Morningstar, Inc. U.S. only. Reflects asset-weighted average U.S. combined mutual fund and ETF expenses, as a share of average new U.S. assets. Updated mid-February / March for the previous year.

Sources: Vanguard and Morningstar, Inc. U.S. only. Reflects asset-weighted average U.S. combined mutual fund and ETF expenses, as a share of average new U.S. assets. Updated mid-February / March for the previous year.

Vanguard Effect:

Lower costs, higher value since 1975

An image of a graph displaying historical average U.S. mutual fund and ETF expense ratios and compares Vanguard's expense ratio versus  competitors as represented by using Morningstar data. For 1998, Vanguard's average expense ration was 0.28% compared to the industry average of 0.77%.  Sources: Vanguard and Morningstar, Inc. U.S. only. Reflects asset-weighted average U.S. combined mutual fund and ETF expenses, as a share of average new U.S. assets. Updated mid-February / March for the previous year. An image of a graph displaying historical average U.S. mutual fund and ETF expense ratios and compares Vanguard's expense ratio versus  competitors as represented by using Morningstar data. For 1998, Vanguard's average expense ration was 0.28% compared to the industry average of 0.77%.  Sources: Vanguard and Morningstar, Inc. U.S. only. Reflects asset-weighted average U.S. combined mutual fund and ETF expenses, as a share of average new U.S. assets. Updated mid-February / March for the previous year.

Sources: Vanguard and Morningstar, Inc. U.S. only. Reflects asset-weighted average U.S. combined mutual fund and ETF expenses, as a share of average new U.S. assets. Updated mid-February / March for the previous year.

Vanguard Effect:

Lower costs, higher value since 1975

An image of a graph displaying historical average U.S. mutual fund and ETF expense ratios and compares Vanguard's expense ratio versus  competitors as represented by using Morningstar data. For 1996, Vanguard's average expense ration was 0.29% compared to the industry average of 0.79%.  Sources: Vanguard and Morningstar, Inc. U.S. only. Reflects asset-weighted average U.S. combined mutual fund and ETF expenses, as a share of average new U.S. assets. Updated mid-February/March for the previous year. An image of a graph displaying historical average U.S. mutual fund and ETF expense ratios and compares Vanguard's expense ratio versus  competitors as represented by using Morningstar data. For 1996, Vanguard's average expense ration was 0.29% compared to the industry average of 0.79%.  Sources: Vanguard and Morningstar, Inc. U.S. only. Reflects asset-weighted average U.S. combined mutual fund and ETF expenses, as a share of average new U.S. assets. Updated mid-February/March for the previous year.

Sources: Vanguard and Morningstar, Inc. U.S. only. Reflects asset-weighted average U.S. combined mutual fund and ETF expenses, as a share of average new U.S. assets. Updated mid-February / March for the previous year.

Vanguard Effect:

Lower costs, higher value since 1975

An image of a graph displaying historical average U.S. mutual fund and ETF expense ratios and compares Vanguard's expense ratio versus  competitors as represented by using Morningstar data. For 1995, Vanguard's average expense ration was 0.31% compared to the industry average of 0.82%.  Sources: Vanguard and Morningstar, Inc. U.S. only. Reflects asset-weighted average U.S. combined mutual fund and ETF expenses, as a share of average new U.S. assets. Updated mid-February / March for the previous year. An image of a graph displaying historical average U.S. mutual fund and ETF expense ratios and compares Vanguard's expense ratio versus  competitors as represented by using Morningstar data. For 1995, Vanguard's average expense ration was 0.31% compared to the industry average of 0.82%.  Sources: Vanguard and Morningstar, Inc. U.S. only. Reflects asset-weighted average U.S. combined mutual fund and ETF expenses, as a share of average new U.S. assets. Updated mid-February / March for the previous year.

Sources: Vanguard and Morningstar, Inc. U.S. only. Reflects asset-weighted average U.S. combined mutual fund and ETF expenses, as a share of average new U.S. assets. Updated mid-February / March for the previous year.

Vanguard Effect:

Lower costs, higher value since 1975

An image of a graph displaying historical average U.S. mutual fund and ETF expense ratios and compares Vanguard's expense ratio versus  competitors as represented by using Morningstar data. For 1989, Vanguard's average expense ration was 0.35% compared to the industry average of 0.88%.  Sources: Vanguard and Morningstar, Inc. U.S. only. Reflects asset-weighted average U.S. combined mutual fund and ETF expenses, as a share of average new U.S. assets. Updated mid-February / March for the previous year. An image of a graph displaying historical average U.S. mutual fund and ETF expense ratios and compares Vanguard's expense ratio versus  competitors as represented by using Morningstar data. For 1989, Vanguard's average expense ration was 0.35% compared to the industry average of 0.88%.  Sources: Vanguard and Morningstar, Inc. U.S. only. Reflects asset-weighted average U.S. combined mutual fund and ETF expenses, as a share of average new U.S. assets. Updated mid-February / March for the previous year.

Sources: Vanguard and Morningstar, Inc. U.S. only. Reflects asset-weighted average U.S. combined mutual fund and ETF expenses, as a share of average new U.S. assets. Updated mid-February / March for the previous year.

Vanguard Effect:

Lower costs, higher value since 1975

An image of a graph displaying historical average U.S. mutual fund and ETF expense ratios and compares Vanguard's expense ratio versus  competitors as represented by using Morningstar data. For 1986, Vanguard's average expense ration was 0.46% compared to the industry average of 0.77%.  Sources: Vanguard and Morningstar, Inc. U.S. only. Reflects asset-weighted average U.S. combined mutual fund and ETF expenses, as a share of average new U.S. assets. Updated mid-February / March for the previous year. An image of a graph displaying historical average U.S. mutual fund and ETF expense ratios and compares Vanguard's expense ratio versus  competitors as represented by using Morningstar data. For 1986, Vanguard's average expense ration was 0.46% compared to the industry average of 0.77%.  Sources: Vanguard and Morningstar, Inc. U.S. only. Reflects asset-weighted average U.S. combined mutual fund and ETF expenses, as a share of average new U.S. assets. Updated mid-February / March for the previous year.

Sources: Vanguard and Morningstar, Inc. U.S. only. Reflects asset-weighted average U.S. combined mutual fund and ETF expenses, as a share of average new U.S. assets. Updated mid-February / March for the previous year.

Vanguard Effect:

Lower costs, higher value since 1975

An image of a graph displaying historical average U.S. mutual fund and ETF expense ratios and compares Vanguard's expense ratio versus  competitors as represented by using Morningstar data. For 1977, Vanguard's average expense ration was 0.61% compared to the industry average of 0.64%.  Sources: Vanguard and Morningstar, Inc. U.S. only. Reflects asset-weighted average U.S. combined mutual fund and ETF expenses, as a share of average new U.S. assets. Updated mid-February / March for the previous year. An image of a graph displaying historical average U.S. mutual fund and ETF expense ratios and compares Vanguard's expense ratio versus  competitors as represented by using Morningstar data. For 1977, Vanguard's average expense ration was 0.61% compared to the industry average of 0.64%.  Sources: Vanguard and Morningstar, Inc. U.S. only. Reflects asset-weighted average U.S. combined mutual fund and ETF expenses, as a share of average new U.S. assets. Updated mid-February / March for the previous year.

Sources: Vanguard and Morningstar, Inc. U.S. only. Reflects asset-weighted average U.S. combined mutual fund and ETF expenses, as a share of average new U.S. assets. Updated mid-February / March for the previous year.

Vanguard Effect:

Lower costs, higher value since 1975

An image of a graph displaying historical average U.S. mutual fund and ETF expense ratios and compares Vanguard's expense ratio versus  competitors as represented by using Morningstar data. For 1976, Vanguard's average expense ration was 0.61% compared to the industry average of 0.64%.  Sources: Vanguard and Morningstar, Inc. U.S. only. Reflects asset-weighted average U.S. combined mutual fund and ETF expenses, as a share of average new U.S. assets. Updated mid-February / March for the previous year. An image of a graph displaying historical average U.S. mutual fund and ETF expense ratios and compares Vanguard's expense ratio versus  competitors as represented by using Morningstar data. For 1976, Vanguard's average expense ration was 0.61% compared to the industry average of 0.64%.  Sources: Vanguard and Morningstar, Inc. U.S. only. Reflects asset-weighted average U.S. combined mutual fund and ETF expenses, as a share of average new U.S. assets. Updated mid-February / March for the previous year.

Sources: Vanguard and Morningstar, Inc. U.S. only. Reflects asset-weighted average U.S. combined mutual fund and ETF expenses, as a share of average new U.S. assets. Updated mid-February / March for the previous year.

Vanguard Effect:

Lower costs, higher value since 1975

An image of a graph displaying historical average U.S. mutual fund and ETF expense ratios and compares Vanguard's expense ratio versus  competitors as represented by using Morningstar data. For 1975, Vanguard's average expense ration was 0.68% compared to the industry average of 0.73%.  Sources: Vanguard and Morningstar, Inc. U.S. only. Reflects asset-weighted average U.S. combined mutual fund and ETF expenses, as a share of average new U.S. assets. Updated mid-February / March for the previous year. An image of a graph displaying historical average U.S. mutual fund and ETF expense ratios and compares Vanguard's expense ratio versus  competitors as represented by using Morningstar data. For 1975, Vanguard's average expense ration was 0.68% compared to the industry average of 0.73%.  Sources: Vanguard and Morningstar, Inc. U.S. only. Reflects asset-weighted average U.S. combined mutual fund and ETF expenses, as a share of average new U.S. assets. Updated mid-February / March for the previous year.

Sources: Vanguard and Morningstar, Inc. U.S. only. Reflects asset-weighted average U.S. combined mutual fund and ETF expenses, as a share of average new U.S. assets. Updated mid-February / March for the previous year.

Vanguard Effect:

Lower costs, higher value since 1975

An image of a graph displaying historical average U.S. mutual fund and ETF expense ratios and compares Vanguard's expense ratio versus competitors as represented by using Morningstar data. For 2021, Vanguard's average expense ration was 0.09% compared to the industry average of 0.49%.  Sources: Vanguard and Morningstar, Inc. U.S. only. Reflects asset-weighted average U.S. combined mutual fund and ETF expenses, as a share of average new U.S. assets. Updated mid-February / March for the previous year. An image of a graph displaying historical average U.S. mutual fund and ETF expense ratios and compares Vanguard's expense ratio versus competitors as represented by using Morningstar data. For 2021, Vanguard's average expense ration was 0.09% compared to the industry average of 0.49%.  Sources: Vanguard and Morningstar, Inc. U.S. only. Reflects asset-weighted average U.S. combined mutual fund and ETF expenses, as a share of average new U.S. assets. Updated mid-February / March for the previous year.

Sources: Vanguard and Morningstar, Inc. U.S. only. Reflects asset-weighted average U.S. combined mutual fund and ETF expenses, as a share of average new U.S. assets. Updated mid-February / March for the previous year.

Vanguard logo

Vanguard is the trusted name in investing. Since our founding in 1975, we've put investors first.